
Machine Learning Maps Soil Salinity at Depth—and Shows Where Predictions
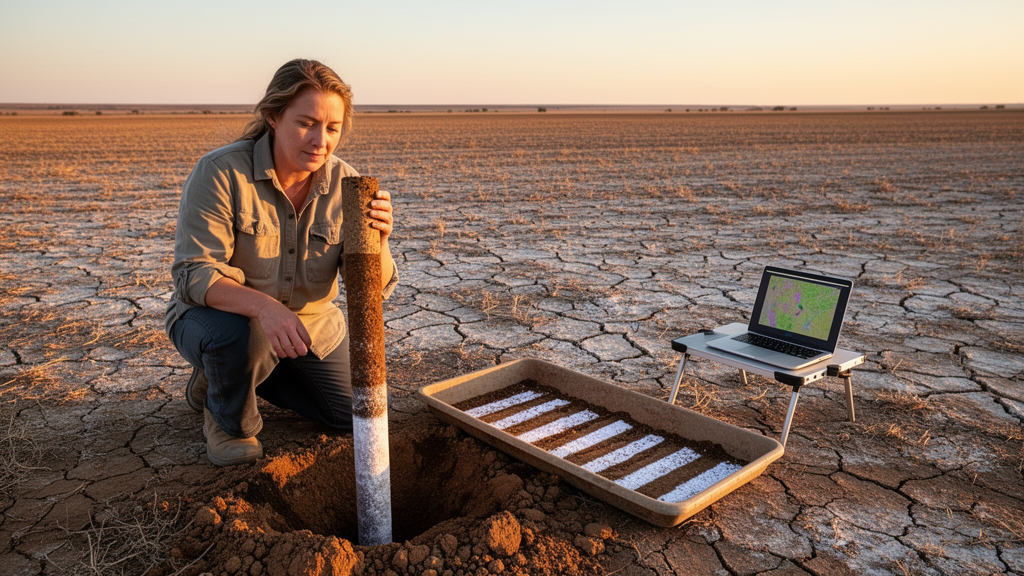
A new study published in Scientific Reports describes a method that uses digital maps and machine learning to predict how salty soil is at different depths. The researchers measured soil electrical conductivity (EC), which is commonly used to estimate how much salt is in soil. They made predictions for five standard depth ranges, from the surface down to 125 centimeters, in Shandong Province in eastern China. Importantly, the method also estimates how uncertain each prediction is. The researchers used data from 617 soil profiles and organized the measurements into standard depth layers with a mathematical method called equal-area quadratic spline functions.
The researchers collected environmental data at a resolution of 30 meters. These data included satellite signals linked to soil salt, plant health, climate, and the shape of the land. Because many of these measurements contained similar information, the team used principal component analysis to reduce overlap between them before training Quantile Regression Forest (QRF) models. This machine learning method estimates a range of possible values rather than just one predicted value. In this study, it was used to calculate 90% prediction intervals for soil electrical conductivity at each depth. The researchers tested the model's accuracy using repeated 10-fold cross-validation.
The results showed a clear pattern: the model became less accurate as the soil depth increased. The coefficient of determination, a measure of how well the model explains differences in the data, dropped from 0.79 in the 0–25 cm layer to 0.51 in the 100–125 cm layer. At the same time, the root mean square error, which measures prediction errors, rose from 0.142 to 0.295 dS m⁻¹. This means the model explained nearly four-fifths of the differences in salt levels near the surface, but only about half of the differences at the deepest layer. Its typical prediction error also roughly doubled.
The factors that helped the model make predictions also changed with depth. Near the surface, satellite-based measurements that can detect salt in soil—including SSIB, CSI, and SC—were the most important predictors. This is because salty soils can leave patterns in the light reflected back from Earth's surface that satellites can detect. Below 50 centimeters, these satellite measurements became less important. Instead, the topographic wetness index, valley depth, relative slope position, and climate measurements played a larger role.
This suggests that satellite signals are more useful for predicting salt levels near the surface, while water movement across the land, land shape, and climate matter more deeper underground. The maps generally predicted the highest electrical conductivity values in eastern and southeastern Shandong. The greatest uncertainty in the predictions appeared in the western and central transition areas of the province.
The fact that areas with the highest predicted salt levels were not the same as areas with the greatest uncertainty is important for land managers. The maps can show where salt damage is likely to be serious and where the predictions should be treated more carefully. The QRF models provide 90% prediction intervals, giving a calculated range of possible values for every predicted electrical conductivity measurement instead of presenting a single number that might seem more certain than it really is.
Using quantile regression forests affects how these maps should be understood. Traditional regression methods usually give one central estimate. QRF models instead estimate the range of likely electrical conductivity values for the conditions being studied, allowing the researchers to report both a prediction and an interval showing its uncertainty. Together with the equal-area quadratic spline method, which turns soil profile measurements into consistent depth layers, this approach makes it possible to compare predictions across all five depth ranges.
The study examined only one province, and its accuracy measurements came from cross-validation rather than checks against independent field measurements. As a result, it remains unclear how well the method would work in other regions or with different amounts of soil sampling. The decline in accuracy with depth also means that predictions for deeper soil layers are supported by less reliable evidence than predictions near the surface.
By combining environmental data for different soil depths with machine learning that estimates uncertainty, the study shows that it is possible to create detailed soil salinity maps with uncertainty estimates throughout the soil profile, not just at the surface. These maps could help people monitor soil more effectively and manage land based on local conditions, as long as they take the reported uncertainty ranges into account when using the predictions.
Subject of Research: Mapping soil salinity at different depths and estimating prediction uncertainty using quantile regression forests
Article Title: Mapping soil salinity and prediction uncertainty across different depths using quantile regression forests
Article References: Zhang, H., Han, D., & Wang, X. (2026). Mapping soil salinity and prediction uncertainty across different depths using quantile regression forests. Scientific Reports. https://doi.org/10.1038/s41598-026-77408-6
Image Credits: AI Generated
DOI: 10.1038/s41598-026-77408-6
Keywords: soil salinity, digital soil mapping, quantile regression forests, electrical conductivity, prediction uncertainty, Shandong Province, machine learning, spectral indices, soil depth, cross-validation, environmental data, land management