
Anthropic’s IPO Video Sees 35%+ Adjusted Margins; Q3 Was 15%
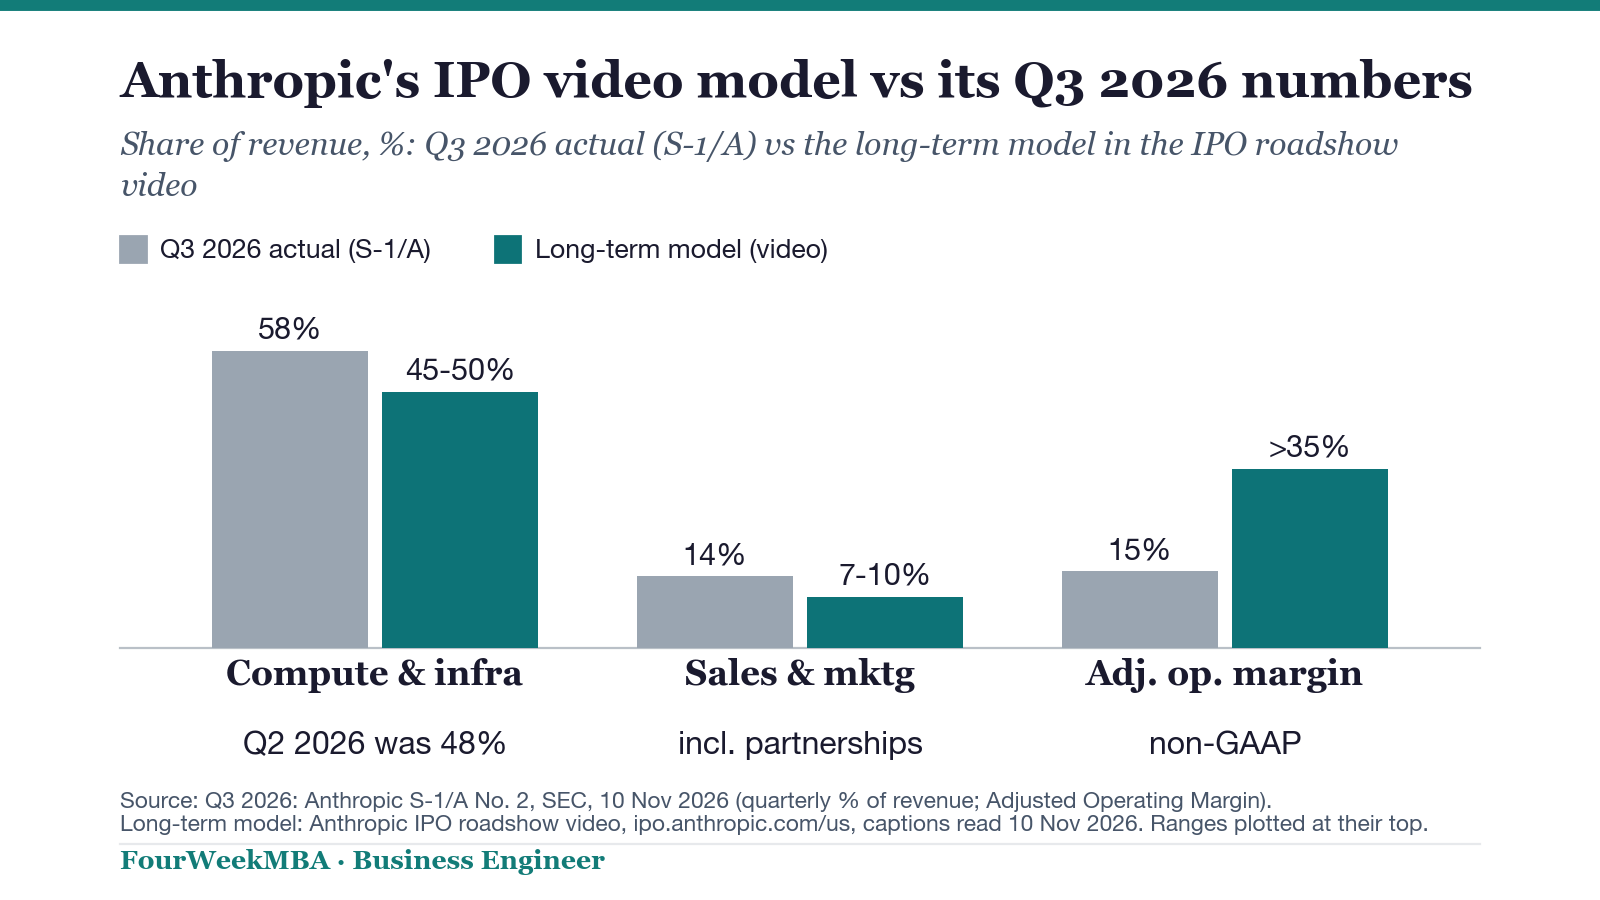
Anthropic has posted a roadshow video, about 41 minutes long, on its website for US investors in its IPO. The video's financial section describes a long-term plan: “We believe Anthropic can deliver adjusted operating margins of more than 35%”, according to the video's captions. Its S-1/A filing from 10 November reports an Adjusted Operating Margin of 15% for the third quarter of 2026.
The video also says that computing and infrastructure costs should eventually reach “approximately 45 to 50% of revenue”. In the third quarter, these costs were 58% of revenue, according to the filing. That is 8 to 13 percentage points above the target range, based on our calculations. In the second quarter, the figure was 48%, which was within the range. We could not find this long-term plan in the S-1/A text. As of 14:24 UTC, there was no free writing prospectus on EDGAR.
What the Video Says About Margins
The captions do not identify the speakers by name. In the financial section, the speakers refer to earlier speakers as “Tom” and “Paul”. We quote the captions as published, rather than using our own transcription.
After the statement about margins above 35%, the captions say: “We see a path for compute and infrastructure expenses to trend towards approximately 45 to 50% of revenue”. About sales, the captions say: “we expect sales, marketing and partnership costs to trend towards 7 to 10% of revenue, as partner fees become a smaller share of revenue as we scale”.
For the other costs, the captions say: “we expect personnel and other operating expenses combined to trend towards 7 to 10% of revenue, as Claude makes our teams more productive and we grow headcount efficiently”.
The video says three things will help the company reach a margin above 35%: “continued efficiency gains, a greater share of Anthropic Direct capacity, and more of our compute shifting towards inference”. It does not say when the company expects to reach this target.
The S-1/A describes the same computing cost without giving a target: “compute and infrastructure expenses as a percentage of revenue will depend primarily on how our revenue scales relative to our total committed compute cost base”.
The Video's Figures Compared with the Filing
About its results, the video captions say: “In Q3, we earned nearly $17 billion of revenue, up 12 times year over year. And year to date, we've delivered a compute margin of 43%, gross margin of 85%, adjusted operating margin of 12% and positive free cash flow”.
The filing reports quarterly revenue of $16,956 million and an Adjusted Operating Margin of 12% for the first nine months of the year. The filing text we searched does not give a compute margin. Computing and infrastructure costs for the nine months were $18,808 million, compared with revenue of $33,242 million. This means 56.6% of revenue went to these costs, leaving 43.4%, based on our calculations. This matches the video's 43% figure.
The gross margin figure also matches our calculations. The filing does not state the margin directly, but its notes group expenses by type. Cost of revenue was $4,812 million for the first nine months. This leaves 85.5% of revenue, based on our calculations. The comparable figure for the same period in 2025 was 29.4%. We could not find a free cash flow figure in the S-1/A text. The filing reports $6.6 billion in net cash from operating activities over the nine months. After subtracting $925 million spent on property and equipment, the result is $5.6 billion, based on our calculations. The video does not explain how it defines free cash flow.
Another statement in the video matches the filing: “We grew revenue by more than 45x, while computing infrastructure costs grew only 10x”. From the first quarter of 2025 to the third quarter of 2026, revenue increased from $376 million to $16,956 million, or 45.1 times. Compute and infrastructure costs increased from $944 million to $9,863 million, or 10.4 times. These figures are based on our calculations. The same caption says gross margin is “over 85%, up from 29% in the same period of 2025”.
Two other statements from the video also match the filing. The video says the amount of code produced per engineer is “up 45x relative to the 2024 average”. The S-1/A says it is “over 45 times the average daily volume in the year ended December 31, 2024”. The video says Claude Cowork's adoption “has exceeded that of Claude Code at the equivalent point”. The filing says it “outpaced the adoption Claude Code achieved at the equivalent point”.
Claims That Appear Only in the Video
We could not find several statements from the video captions in our search of the S-1/A. About prices, the video says: Opus 5.5 “delivered substantial gains in model capability and 40% lower customer costs. This reduction was margin neutral to us because Opus 5.5 is significantly cheaper to serve”. The filing does report a 40% reduction in cost per task, but we could not find the statement that this change did not affect margins.
About costs other than computing, the video says: “our entire non-compute expense base, including sales and marketing personnel and other operating expenses, represents a lower percentage of revenue than the median enterprise software company spends on sales and marketing alone”. About its output, the video says: “In the first nine months of 2026, we shipped 250 models, products and features”.
About computer chips, the video says: “It got Claude running on AMD in just three days with basically no human intervention”. About security, it says Mozilla “used to fix over 20 security bugs per release, and with Mythos Preview, they identified and fixed 271”.
What Is on the Website
The website lists a letter from the founders, the video divided into 11 chapters, highlights from the third quarter of 2026, five customer stories and links to brokers. The highlights include a “>4x” improvement in computing efficiency since the first quarter of 2025. The site measures this by comparing revenue divided by compute and infrastructure costs in Q3 2026 with the same ratio in Q1 2025. The filing's figures give a result of 4.3 times, based on our calculations.
Under “How to participate”, the website links to Charles Schwab, E*TRADE, Fidelity, Robinhood and SoFi. Its FAQ says the final price “is expected to be set on November 18th (EST)” and that shares “are expected to begin publicly trading on November 19th (EST)”. Our article about the roadshow gave 19 or 20 November as the possible trading date. Our article about retail investors explains the share allocation.
When accessed from London, the US address redirected to a UK page that only said “More information to come.” We accessed the US page and video captions using a connection located in the United States.
What the Numbers Show
Our reading of the two documents is that the video explains where Anthropic wants to go, while the filing shows where it is now. We could not find the long-term plan in the S-1/A. The filing says the share of revenue spent on computing depends on how quickly revenue grows compared with the company's total committed computing costs.
Our reading of the quarterly figures also shows that the share of revenue spent on computing does not always move down. It fell to 48% in the second quarter, then rose to 58% in the third quarter. So one quarter within the target range of 45 to 50% does not prove that the company has reached its target.
Anthropic IPO roadshow video (captions), 10 November 2026
“We believe Anthropic can deliver adjusted operating margins of more than 35%”
Three Important Points
FOR THE MARGIN The S-1/A reports an Adjusted Operating Margin of 15% for the third quarter and 12% for the first nine months. The video's target is above 35%, but no date is given for reaching it.
FOR COMPUTE Compute and infrastructure costs were 58% of revenue in the third quarter, compared with the video's target range of 45 to 50%. Based on our calculations, the figure was 8 to 13 percentage points above that range.
FOR THE FIGURES The video's 43% compute margin matches 100% minus the 56.6% share of revenue spent on computing in the filing for the first nine months, based on our calculations. The video's 85% gross margin also matches the 85.5% figure we calculate from the filing's cost of revenue for the same nine-month period.
The Business Engineer View
This story relates to the Business Engineer framework called The Subsidized AGI Economy.
The framework argues: “The accounting measure (gross margin) and the strategic measure (harness density) are designed to move in opposite directions.”
In our view, the roadshow video describes this choice in its own words. It says efficiency improvements create “capital that we get to allocate”. The company can use these savings to lower prices for customers or keep them as a higher margin. The framework was published in June and does not discuss the video.
What Has Not Been Confirmed
The video does not give a year for reaching its long-term target and describes the 35% figure using a non-GAAP measure. The S-1/A explains that Adjusted Operating Margin excludes stock-based compensation, charitable contributions that do not involve cash, and the Bartz settlement. The video does not explain how it calculates gross margin or free cash flow. There was no free writing prospectus on EDGAR as of 14:24 UTC. The S-1/A, filed at 11:29 UTC, was the latest filing.
The captions were provided by Anthropic and are not an independent transcript. Earlier coverage includes the $70 to $78 share price range, the $81 billion annual revenue run rate, the $26 billion investment, our guide to Anthropic's IPO, and Anthropic's history of profitability.
The Bottom Line
Anthropic's roadshow video describes a long-term plan that does not appear in the S-1/A text. It aims for adjusted operating margins above 35%, with compute and infrastructure costs at about 45 to 50% of revenue. The filing reports 15% and 58%, respectively, for the third quarter. In the second quarter, compute and infrastructure costs were 48% of revenue.
A note about our sources. Quotes from the roadshow video come from Anthropic's own captions file, which we read on 10 November 2026. The website information comes from ipo.anthropic.com/us. Financial figures come from Anthropic's S-1/A filing with the SEC on 10 November 2026. We checked the EDGAR filing list at 14:24 UTC. All differences, ratios and percentages are based on our calculations. We did not contact Anthropic for this article.
Sources: Anthropic's IPO website for US investors (ipo.anthropic.com/us), read 10 November 2026 · Anthropic roadshow video captions (official .vtt file), read 10 November 2026 · Anthropic, PBC, S-1/A Amendment No. 2, SEC, 10 November 2026 · SEC EDGAR filing list, Anthropic, PBC (CIK 2130357), checked 10 November 2026 at 14:24 UTC